ZCZC AP30
QST de W1AW
Propagation Forecast Bulletin 30 ARLP030
From Tad Cook, K7VVV
Seattle, WA July 19, 2002
To all radio amateurs
SB PROP ARL ARLP030
ARLP030 Propagation de K7VVV
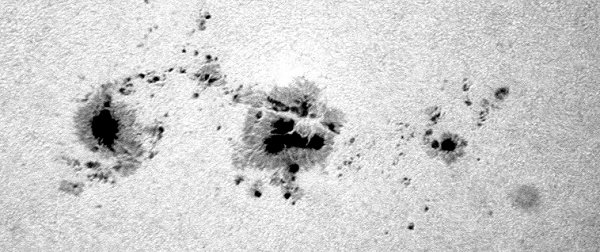
A big, big sunspot crossed the earth-facing side of the sun this week. Sunspot 30 brought a nice short-term rise in the sunspot count and solar flux, but also caused geomagnetic instability, with more to come.
Sunspot 30 first peeked around the eastern limb of the visible solar disk about 10 days ago, and was directly facing earth around July 16. The sunspot number peaked at 209 on July 15, and on the same day the Penticton observatory read a solar flux value of 323.6, clearly off the scale anomaly. NOAA produced an adjusted value of 160 for the day, which is the official solar flux number. A dramatic photo of the sunspot group is currently displayed at http://spaceweather.com/swpod/18jul02/peoples1.jpg . An amateur captured this photo with a digital camera and a telescope with a solar filter.
A full-halo coronal mass ejection blasted away from the sun on Tuesday, which caused unsettled to active conditions on Wednesday. On Thursday there was a solar flare at 0745z.
The average daily sunspot count for the week was up over sixteen points when contrasted with the previous week, and average solar flux rose by nearly sixteen points. Without the downward adjustment of the flux value on July 15, the average for the week would have risen by nearly forty points.
If you go to gopher://sec.noaa.gov/00/indices/DSD you can see the daily solar flux, sunspot number and sunspot area, along with some other indices. It is interesting how the sunspot area kept increasing between July 12 and 17, but the sunspot number peaked on July 15. The daily sunspot number is calculated by taking the number of groups of sunspots and multiplying by 10, then adding the product of this calculation to the number of individual sunspots. So for example, if 12 groups of sunspots were observed, but there were 43 individual spots, the sunspot number would be 163. The actual daily number is calculated by taking observations from a number of places around the globe. This is how it is possible for the total area covered by sunspots to keep rising after the daily sunspot number has declined, because while sunspots may be darkening a larger area, this can happen when the number of spots and groups of spots is lessening.
You can grab some files of yearly sunspot data going way back to 1818 at ftp://ftp.ngdc.noaa.gov/STP/SOLAR_DATA/SUNSPOT_NUMBERS/ .
For the next few days the estimated planetary A index is expected to rise to 20 on Friday, then 15 on Saturday and back to around 20 on Sunday. Solar flux is expected to rise from 185 on Friday and Saturday to 190 on Sunday, then 195 on Monday and Tuesday.
We are in a summertime propagation mode, which is generally not as good for HF communications as spring or fall. High noise levels and shorter periods of darkness in the northern hemisphere make propagation on 160 and 80 meters difficult.
10 meters is not nearly as good as in the spring or fall, although there is some sporadic E layer skip. 20 and 15 meters are probably the best bet for long distance propagation, with 20 meters being great to the Far East and the Pacific late at night. South America is an easy shot from North America, with 80 and 40 meters good after dark, and 30 meters opening earlier in the evening. 20 meters is also good at night in this direction, but opening earlier than the path to the Pacific. 15 meters is great over this trans-equatorial path from the middle of the day to the early morning hours, closing before sunset. Toward Europe, 20 meters is the best bet, but during the evening hours, not during the day as it was in the spring.
After last week's mention of the variation in the observed solar flux tracking with the slight change in distance from the sun, W7YED asked if this caused higher solar flux numbers in the winter than in summer. Actually the variation in observed flux values caused by the change in distance is slight, only a few points. This is not enough to really affect HF propagation as much as week to week changes in solar activity, particularly in the years around the peak of the solar cycle.
Sunspot numbers for July 11 through 17 were 99, 93, 141, 152, 209, 182 and 179, with a mean of 150.7. 10.7 cm flux was 136.4, 133.2, 134.9, 143.8, 160, 171.5, and 180, with a mean of 151.4. Estimated planetary A indices were 9, 20, 8, 6, 8, 11, and 18, with a mean of 11.4.